
Land use and cover maps for Mato Grosso State in Brazil from 2001 to 2017
by Rolf Simoes¹, Michelle C. A. Picoli¹, Gilberto Camara², Adeline Maciel¹, Lorena Santos¹, Pedro R. Andrade¹, Alber Sánchez¹, Karine Ferreira¹ & Alexandre Carvalho³
¹Brazil’s National Institute for Space Research (INPE), São José dos Campos, Brazil.
²Group on Earth Observations (GEO), Geneva, Switzerland.
³Institute of Applied Economic Research (IPEA), Brasília, Brazil.
DOI: https://doi.org/10.6084/m9.figshare.11440461
Publisher: Nature | Published: 27 January 2020
Abstract
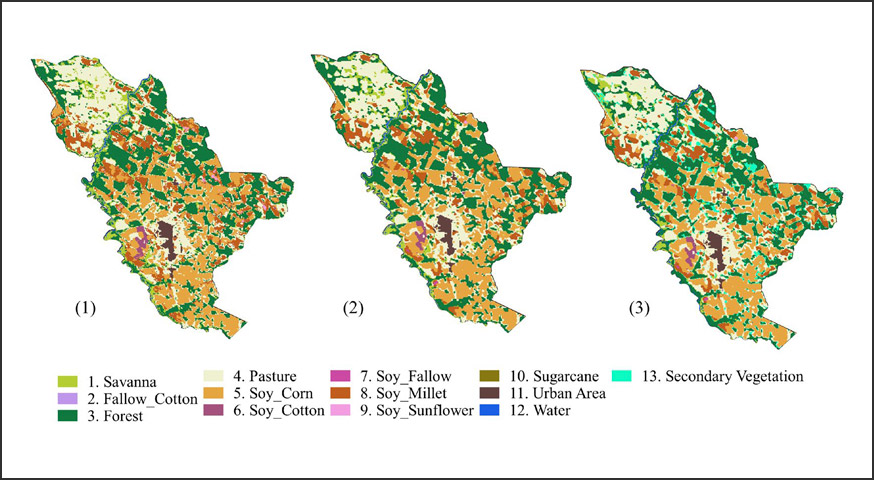
This paper presents a dataset of yearly land use and land cover classification maps for Mato Grosso State, Brazil, from 2001 to 2017. Mato Grosso is one of the world’s fast moving agricultural frontiers. To ensure multi-year compatibility, the work uses MODIS sensor analysis-ready products and an innovative method that applies machine learning techniques to classify satellite image time series. The maps provide information about crop and pasture expansion over natural vegetation, as well as spatially explicit estimates of increases in agricultural productivity and trade-offs between crop and pasture expansion. Therefore, the dataset provides new and relevant information to understand the impact of environmental policies on the expansion of tropical agriculture in Brazil. Using such results, researchers can make informed assessments of the interplay between production and protection within Amazon, Cerrado, and Pantanal biomes.
Keywords: